
The importance of seeing the big picture in the data-driven digital transformation journey: Part 1
After reading this blog, you will be able to visualize a 7-frame big picture with Integration, RPA, and Intelligent Automation (IRIA) solutions, a framework based on multiple transformation projects
While planning for your transformation projects, drawing a big picture of how the proposed and subsequent solutions will perform together, achieving a 1 + 1 = 11 effect, is essential
In my last blog I discussed the reusable decision matrix for technology and tool choices. Now, let us explore what the big picture could be if you complete the first few transformation projects. In this blog, we will not restrict ourselves to solely IRIA-based solutions; the 7-frame big picture can be used to consider all data-driven solutions built in a broader group of technologies.
Let us first understand why we need to have a big picture with a real-life example. Imagine you were a taxi driver in late 2004 (well before Google maps) in one of the big cities. You have been called by a passenger who does not speak your language but knows the road toward the destination based on previous visits.
 This means that the passenger keeps giving you instructions on when to take a right or left turn. As you can imagine, it is quite challenging for you as a driver receiving many and frequent instructions without having a clear destination. We value having destination pictures with milestone instructions.
To put the example in a digital transformation context; we can easily say that the big picture is essential with a transformation project or program, providing a comprehensive plan to your destination, and acting as inspiration to realize business value.
The big picture of digital transformation has 7 different frames:
- Market trends and peer journeys
- End-customer and organization stakeholders’ expectations
- As-Is state - application landscape assessment
- To-Be state - visualization
- Sustainable incremental steps planning
- High-level transformational roadmap
- Transformation challenges and workarounds
In this first part, I will go through frames 1-4, and in my next blog, I will cover frames 5-7. All of which are needed to build a great big picture to succeed in your transformation journey.
1. Market trends and peer journeys
We at Tietoevry see that many customers are realizing that if they use existing data and information effectively, they can cut operating costs. Once that thought settled in, they started exploring what could be done to achieve good results as quickly as possible. Every curious professional is eager to understand what our organizational peers, competitors, and market leaders are doing to gain competitive advantages.
Here I am going to refrain from talking about market trend assessment frameworks considering that they can be overkill if you are in close contact with your customers.
To get a view of market trends and peer journeys, you can use commonly available content and, if needed, invest in more special/custom content. The commonly available content I am referring to can be content like:
- Tech trend surveys from research firms like Zinnov, Everest, HFS Research, etc.
- Market Guide from research firms like Gartner, IDC, Radar, etc.
- Specialized industry reports from industry research firms like SSON, etc.
In addition, the below-given sources add tremendous value to your understanding of peer journeys:
- Event sessions of special groups of professionals like Procurement and Operations, etc.
- White papers or blogs published by your tech product partners like Microsoft, Oracle, etc.
- Articles or blogs published by your SaaS partners like Tietoevry.
- Tech blogs on professional network sites like LinkedIn and KDnuggets, etc.
In addition to the above, if needed, you can invest in a special market research project driven by research firms focused on your industry, peers and competitors. Giving you an excellent picture of what is happening with your market peers.
![]() To conclude - In this frame, you document and track where the market is moving and the direction of your competitors
To conclude - In this frame, you document and track where the market is moving and the direction of your competitors
2. End-customer and organizational stakeholders’ expectations
Let us move from the market to the customers and internal/external stakeholders. Let us divide this section into customer and internal/external stakeholder expectation management.
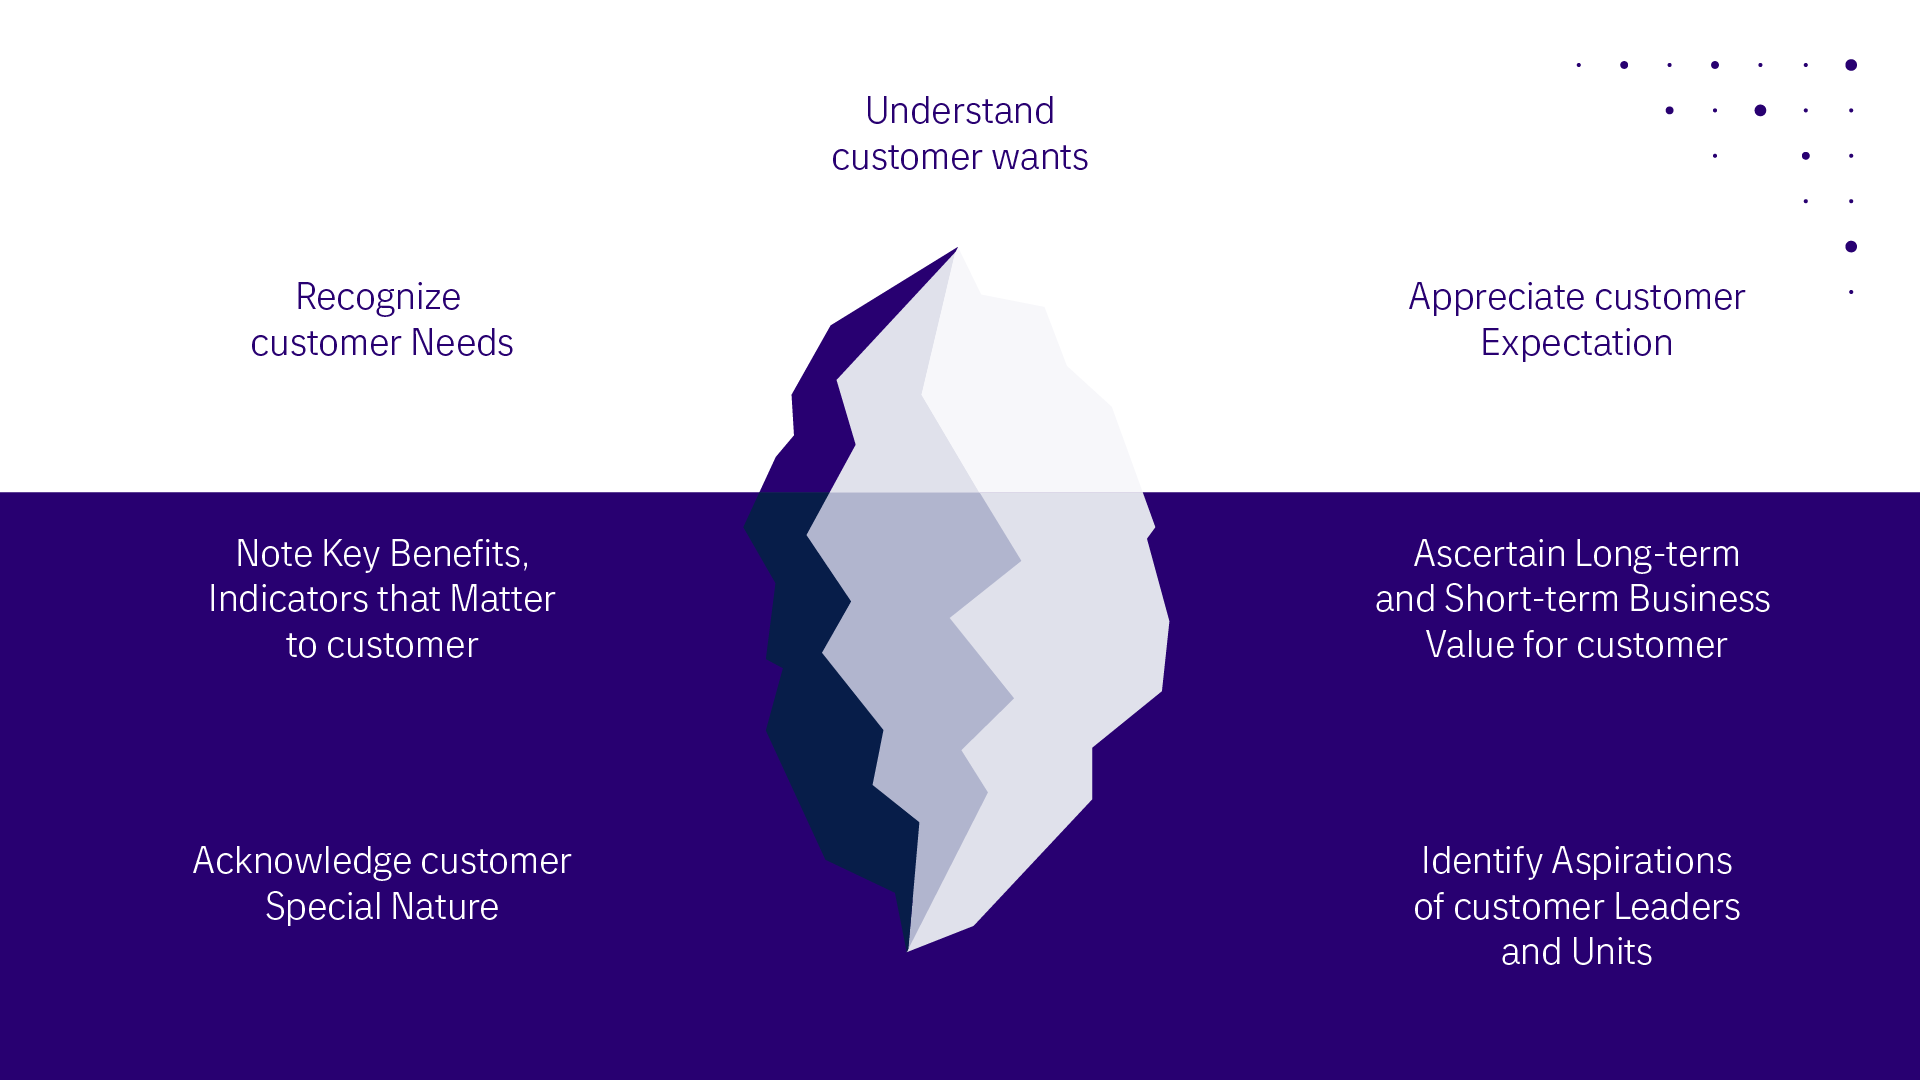
Starting with the customers; it is imperative to understand what the customer is saying explicitly and implicitly. You may ask how to identify customer needs. There are many ways to figure out what is on the customer’s mind.
Some of the common ways are:
- Existing customer data and information
- Customer's customer product & services approach
- Customer feedback and survey reports
- Customer communication about future planning
- Customers procurement and partner approach
- Means-End analysis (Attributes, Benefits & Value)
Typically, we have seen customers look for simple offerings of services, personalized attention, suppliers, focused on value delivery, transparent communication, and accessible, excellent talent from suppliers.
In simple, practical terms, we can say that customers look for:
- suppliers who listen to the customer
- suppliers who catch on to information and needs quickly without efforts on the customer side
- suppliers who are pleasant and responsive to work with
You must document customer expectations and track them as a part of your steering group activities.
In the second part of this section, let us focus on internal and external stakeholders, who are essential value-adding elements in any project. To clarify, internal stakeholders mean your sponsor and support teams (legal, HR, IT Ops, etc.), and external stakeholders can be suppliers and subcontractors, etc.
In the large basket of internal/external stakeholder management activities, stakeholder mapping is an essential first step that can provide the insight your projects require to reach completion smoothly.
Let us discuss key pointers for stakeholder management:
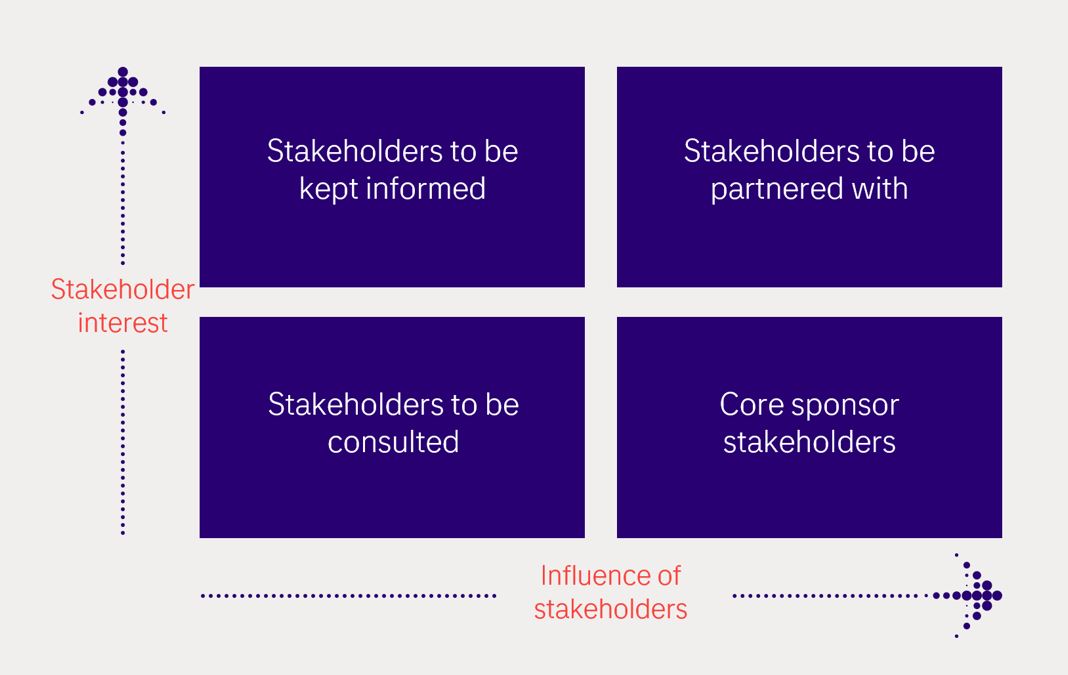 1. Identify the key players at a glance, meaning knowing whom to engage, collaborate or inform at each stage of the project.
2. Assess power, and understand the interests of each stakeholder to define strategies and communication plans accordingly.
3. Making sure that all critical decisions are taken effectively and timely by holding consultations with relevant stakeholders
The picture above shows a sample stakeholder categorization, leading to detailed stakeholder mapping and expectation assessments.
After the assessment, it is vital to synchronize internal/external stakeholders’ expectations and project milestones. At every milestone, it is essential to validate the stakeholders’ thoughts.
You need to list both the customers’ and stakeholders’ expectations and coordinate the project activities to ensure customers and stakeholders are committed (soft or hard) to the project’s success.
![]() To conclude - In this frame, you document and track the expectations of your customer as well as internal/external stakeholders.
To conclude - In this frame, you document and track the expectations of your customer as well as internal/external stakeholders.
3. As-Is state – Application landscape assessment
The As-Is state landscape describes an organization’s IT assets in the form of IT applications. As there are different types of assets, showing them in one structure is an important but complex activity.

To get a clear picture, it is essential to complete an inventory of IT assets and characteristics. Various inventory forms can represent the As-Is application state like matrix, layer structure, etc. The above-shown picture represents one listing form of all the applications with crucial attributes.
The IT business’ hard reality is that the application landscape needs to be progressively refined to enable consistent benefits. In addition to inventory, it’s important to implement processes and tools to ensure the inventory can be maintained effectively and efficiently.
 Here you can see a sample application portfolio assessment report. The picture show categorization of all the applications with size and business outlook (Invest, Migrate, Eliminate or Tolerate)
Typically, you have to analyse, assess and rationalize the technology portfolio, then recommend existing applications to re-host, re-platform, rewrite/replace, consolidate, and decommission.
![]() To conclude - In this frame, you document and track the As-Is State of your application eco-system
To conclude - In this frame, you document and track the As-Is State of your application eco-system
4. To-Be state – Visualization
As any traveller on any journey, you and I always need the target we want to reach – in transformation terms, it is essential that you draw a ‘To-Be State” visualization.
A “To-Be State” visualization can help you prioritize effectively, set better goals, and improve scope, time, and quality. You can make decisions that drive long-term results by developing a complete perspective of a situation.
The critical and consistent factors of the To-Be state visualization is:
- A relevant starting point representing all essential elements of your eco-system
- A pragmatic mindset is key, as visualization will be continuously evolving with every passing day
Below is a sample “To-Be state” visualization drawn by the core transformation team of a customer. Each moving piece in the picture below tells us a vital activity group that plays a crucial role in the transformation journey.
 You can use this or any other To-Be state image as a starting point for drawing your transformation To-Be state vision image. Please reuse the excellent work your peers and market leaders have created as a starting point for your journey. Avoid reinventing the wheel!
Once you have an excellent starting point, you must regularly establish a standard practice to review, customize and enhance the To-Be State Image.
As time progress, your understanding of your business needs increases, resulting in the refinement of the To-Be state picture. The vital factor to consider here is that all enhancements must be made regularly with clear criteria and reasoning.
![]() To conclude - In this frame, you document and track the To-Be state visualization of your application eco-system
To conclude - In this frame, you document and track the To-Be state visualization of your application eco-system
We are well on our way to visualizing the big picture of digital transformation
I have now presented the first 4 frames needed to visualize the big picture. These 4 steps and suggested methods will help you to achieve a more clear direction for your transformation journey. In my next blog I will go through the last 3 frames, (5) Sustainable incremental steps planning, (6) High-level transformational roadmap, and (7) Transformation challenges and workarounds. All of which are needed to complete the big picture.
If you want to discuss how we can support your business, me and my colleagues would be happy to help. We at Tietoevry have a solid capability of advising in the digital transformation journey.
Do not hesitate to reach out!
Curious to know about the final 3 frames of the big picture? Read part 2 here


